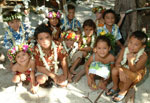
The large distances separating each island from one another makes it difficult for the development of internal relationships. This geographical disadvantage is strengthened by a demographic imbalance.
Demographic facts
 With 268 270 inhabitants in 2012, the population of French Polynesia has doubled on 40 years (see chart below). People are spread on a surface as large as Europe but with only 3,670 km² of emerged land (ie : a density of 73 persons / km²). Out of the 118 islands of French Polynesia, 60 are inhabited and the Society Islands concentrate 87,8% of the total population.
Consequently, most of the economic activity and business relationships with the rest of the world (i.e. mostly USA, New Zealand, Japan and France) is concentrated in this archipelago.
|
Year
|
Inhabitants number
|
|
1971
|
119 668
|
|
1977
|
137 382
|
|
1983
|
166 753
|
|
1988
|
188 814
|
|
1996
|
219 521
|
|
2002
|
244 830
|
|
2007
|
259 596
|
|
2010
|
270 764
|
|
2012
|
268 270
|
Population by archipelagoes (in 2007) :
- Windward Islands : 200.881 persons (74.9 %)
- Leeward Islands : 34.622 persons (12,9 %)
- Tuamotu & Gambier Islands : 16 664 persons (6,2 %)
- Marquesas Islands : 9.264 persons (3,4 %)
- Australs Islands : 6,839 persons (2,6 %)
The most crowded districts (Census 2012) are :
- Faa’a (Tahiti) : 29 687 persons
- Punaauia (Tahiti) : 27 613 persons
- Papeete (Tahiti) : 25 769 persons
Those 3 districts totalize alone 68.4 % of the population of Tahiti (183 645 persons).
Demographic balance of 2010 :
Life expectancy is 78.3 years for women and 73.2 years for men. Men represent 51.3% of the population and women 48.7%
Population growth is about 1.2% per year and still young but gets older. At present, people aged 20 to 59 years are the majority (55%). More than 60 years representing 8.7% of the population and the proportion of young people under twenty years has decreased and reached 36%.
Key data for France and French Polynesia :
|
||||||||||||||||||||||||||||||||||||||||||
Ethnic diversity
The Economical, Social and Cultural Council (CESC) divided the population in 4 different ethnic groups :
- Maohi community : 65% (Polynesian natives)
- “Demis” community : 16% (issued from a mix marriage – Euro-Polynesian culture)
- Chinese community : 5% (immigrated during the first quarter of the 20th century, mostly from the southeast province of Kwantung – China). They officially acquired the French citizenship in 1974 thanks to the January 9th, 1973 Law)
- Popa’a community : 12% (98% are French. They are strongly represented in Administrative organizations (schools, government…) and the medical sector.
Source :
– Institut Statistique de Polynésie Française (www.ispf.pf)
– INSEE
– DOM TOM – Gérard BELORGEY – Geneviève BERTRAND